Resources
Insights
Australian Energy & Environmental Market Update - September 2025

Australian Energy & Environmental Market Update - September 2025

The latest edition of our monthly Australian Energy & Environmental Market Update is now available. Keep reading for energy and environmental price movements, policy updates and other news.

Updated
October 13, 2025
Published
October 13, 2025
Australian Energy & Environmental Market Update - September 2025

Australian Energy & Environmental Market Update September 2025

Highlights from this edition

Electricity markets

  • This month in the market, electricity spot prices continued to soften from June’s highs. A drop in NEM-wide demand and greater renewable penetration resulted in subdued pricing.
  • Futures prices showed mixed movement across states with overall trade volume declining compared to August.
  • Wind asset performance was spotlighted this month, with generation increasing slightly, mainly driven by Tasmanian wind farms’ exceptional performance.

Environmental markets

  • LGC prices continued to decline through September, with persistent selling pressure dominating much of the month.
  • VEEC activity remained subdued early month, before the commercial solar activity announcement led to a material drop in pricing late month.
  • STC spot and forward markets held strong with no change in monthly prices, although some fluctuations in activity between surplus and deficit throughout September.
  • In contrast, PRC and ESC markets experienced notable volatility, with ESC prices trending upward to $26/MWh, while PRCs fell below $3/certificate.

Other market developments

  • Key market developments this month include AGL signing a 15-year wind PPA and a new curtailment record set for the NEM.

Australian electricity spot market

Monthly electricity spot market trends

  • NEM-wide volume weighted average spot price (VWAP) continued to soften, decreasing by 36% from August 2025.
  • Monthly NEM-wide demand decreased by 1,974 GWh from August, landing at 17.1 TWh total. Monthly average Solar rooftop generation and wind generation increased by ~572 GWh and ~196 GWh respectively, which decreased reliance on gas-fired generation (573 GWh decrease).
  • TAS was a notable outlier this month, with a steep 77% decline in spot prices compared to August, underpinned by strong RE generation. Gas-fired generation in TAS experienced a yearly low (0.62 GWh) down 99.19% from last month’s high, due to improved generation, mainly from wind, solar (rooftop) and hydro sources, including run-of-river hydro as 22 of 40 lake levels are currently spilling due to high water levels.
  • VIC has experienced the greatest year-on-year change from September 2024,with the VIC September 2025 VWAP 218% higher. This increase reflects milder weather in September 2024, stronger wind generation, and lower coal-fired output. Notably, VIC’s year on year increase was largely influenced by a material change in negative price setting where the lower LGC spot value reduced the magnitude of negative prices even though their frequency remained  similar.
  • Negative price intervals across the NEM increased by 20%, with QLD and NSW experiencing the most significant rises - underscoring the contrast between average prices for this month and last.

Daily electricity spot market trends

  • On 1st September, the NEM saw its first material price spike in over two weeks. Elevated spot prices triggered aggressive battery cycling, which increased demand during key intervals, amplifying price volatility across the day.
  • The beginning of spring has seen greater renewable penetration across all states in the NEM, resulting in lower prices compared to August 2025. Fewer instances of prices exceeding $300 /MWh and increase in negative prices has compressed overall price volatility.
  • The spike in prices between the 9th and 13th was caused by low wind generation (~30 GWh less per day) across then NEM, which resulted in an increase in dispatch of gas generation (~15 GWh more per day) to meet market demand.
  • An increase in NEM-wide wind generation and rooftop solar created intervals of greater supply, causing prices to fall. One example of this occurred on the 14th, where a 270% increase in wind generation across the NEM (led particularly by VIC and SA) dramatically shifted the supply-demand balance, resulting in the negative prices seen in VIC and SA.

Electricity Futures market

  • In the futures market, prices showed mixed movements this month, with notable strength in VIC and QLD across CY26-28 futures, which rose by $1.9/MWh in QLD and $0.7/MWh in VIC on average.
  • Futures Prices fell in NSW and SA through CY26-28 by -$0.54/MWh and -$0.84/MWh respectively
  • Futures and caps traded volume (MWh) declined in September compared to August, with options trading increasing slightly.
Log in to the CORE Markets platform for more data, insights and commentary. Don’t have an account? Learn more

Renewables markets

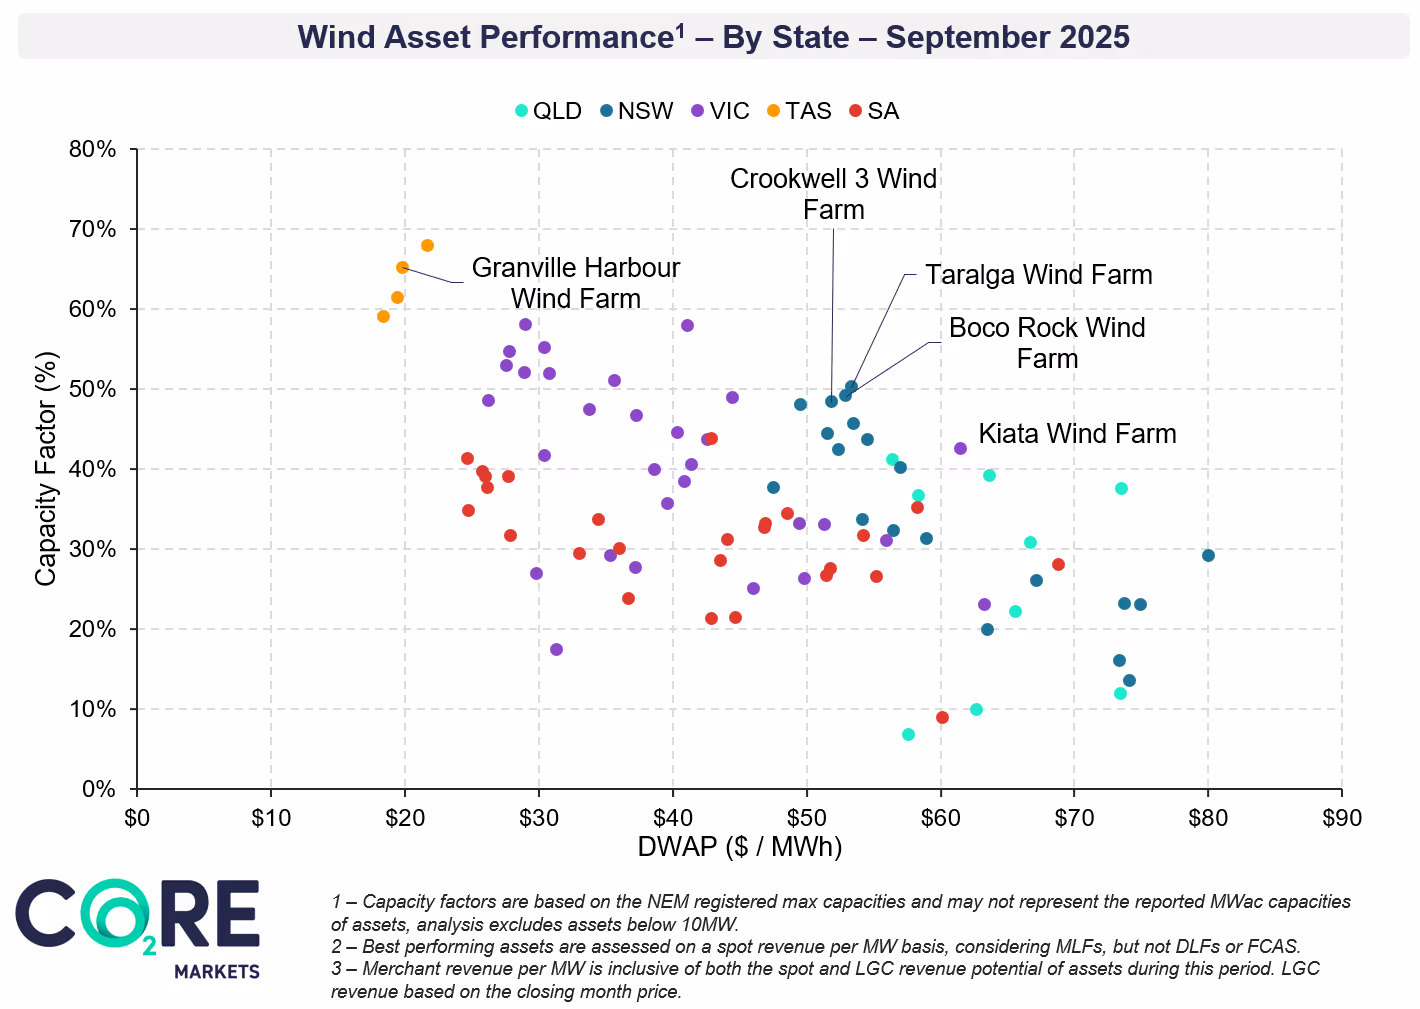
NEM-wide variable Renewable Energy (VRE) penetration increased by 0.25 percentage points from last month now sitting at 41.58%. This increase was mainly driven by an uptick in wind and rooftop solar across the NEM.

Monthly rotating focus: Wind asset performance

Each month we feature a different asset type - rotating between coverage of solar, wind and BESS projects. This month’s focus is wind asset performance.

  • Aggregate wind generation increased in September, recording an 18.4% increase across the NEM compared to August.
  • Average capacity factors for wind assets rose to 32%, up 1.83 percentage points month-on-month. TAS was the greatest outlier, achieving an average regional capacity factor of 61%. The state’s four wind assets generated 94 GWh more than last month, marking a 58% increase in output.
  • Dispatch weighted average prices (DWAPs) fell across all states, with the NEM-wide average at $45.39 /MWh, down 39% month-on-month, reflecting subdued spot market outcomes.
  • Overall, average total merchant revenue per MW for wind declined by 47% compared to August, now sitting at ~$14,200/MW/month, driven by spot price decreases across all NEM regions, most notably in TAS.
Looking for more in-depth renewables asset analysis?
Learn more about our Wholesale Energy and Offtake Market Report, an important and recurring pulse check for renewable energy buyers and seller.

Environmental markets

Large-scale Generation Certificates (LGCs)

  • The LGC forward markets continued to face structural weakness across the curve, with persistent selling pressure dominating much of September.
  • Traded volumes of spot and Cal25s were heavy early in the month, as participants adjusted positions following the mid-August rebound. Sentiment however remained cautious amid limited compliance buying and a lack of notable policy signal shifts.
  • While opportunistic buying periodically steadied prices, forward levels trended lower through the back half of the month as liquidity concentrated in the near-dated vintages.
  • A modest late-month pricing rebound in the spot reflected short-covering rather than a shift in fundamentals
Log in to the CORE Markets platform for more data, insights and commentary. Don’t have an account? Learn more

Small-scale Technology Certificates (STCs)

  • STCs fluctuated between surplus and deficit throughout September, reflecting continued large-scale Government battery STC purchases and strong weekly submissions, which peaked near 1.9 million per week.
  • The Clearing House stabilised with spot holding firm around $39.90/MWh. Forward market activity remained strong and issuance data indicates continued high participation through Q4 as installers capitalise   on stable policy settings.

Victorian Energy Efficiency Certificates (VEECs)

  • VEECs oscillated within a tight range through much of early September before succumbing to sustained selling pressure mid-month.
  • The release of upgraded VEU registry functionality restored transparency around creation data, revealing continued strength in Activities 6 (high-efficiency air conditioning) and 44A, B and C (heat pump/water heater activities) despite July’s rule amendments.
  • Importantly, the mid-month announcement of a new activity crediting the installation of commercial-scale solar systems, corresponded to a softening in spot and forward prices.
  • Work is ongoing to quantify the scale of additional supply for which this new activity will be responsible.

Energy Saving Certificates (ESCs)

  • ESCs saw a volatile month as markets considered impacts of August’s rule changes. Early momentum above $24/MWh faded before a late-month rebound pushed prices toward $26/MWh amid tight near-term supply.
  • The volume of registrations fluctuated widely, partly due to administrative catch-ups following the Gazettal, while forward premiums widened as originators adjusted for higher compliance costs.
  • The emergence of forward buying interest in September reflects both tightening availability and the desire to hedge against further regulatory impacts.

Peak Reduction Certificates (PRCs)

  • PRCs were consistently the most volatile certificate type during the month, following the Department’s announcement of a review into the CY26/27 target after the suspension of the BESS1 activity.
  • The news triggered a sharp sell-off, with spot briefly dipping below $3 /certificate before stabilising around $3 /certificate.
  • While creation levels remain heavily reliant on the waning BESS1 pipeline, late-month data showed emerging contributions from BESS2 (VPPs).
  • While  market expectations that the BESS2 activity would not be a like-for-like replacement for BESS1 in terms of certificate generation have been affirmed, certificate registrations  under the new activity have been higher than expected.

Looking for ACCU coverage? Read our ACCU Market Monthly Report here.
Log in to the CORE Markets platform for more market data, insights and commentary. Don’t have an account? Learn more

Market news

AGL signs 15-year wind PPA

  • AGL has signed a 15-year PPA to buy nearly half the output of the proposed 288 MW Tilt Renewables-owned Palmer Wind Project in South Australia. The project is expected to achieve COD in December 2028 and is estimated to avoid 212,000 tonnes of greenhouse gas emissions annually.
  • Further to AGL’s 20% project ownership and the successful awarding of a CIS contract under Tender 1, this offtake agreement further supports Tilt in progressing the project to FID.

NEM Sets New Curtailment Record

  • On 14th September 2025, the NEM saw elevated renewable energy generation and low grid demand resulting in a new  curtailment peak of 10.21 GW, nearly 1.5 GW above the previous record set in September last year.
  • For the first time in the NEM, wind curtailment broke through 5 GW with Victoria being the most impacted with a new high of 3.5 GW.  Total curtailment (solar and wind) reached a new peak of 4.6 GW in South Australia and 8.4 GW in Victoria.
  • The combination of actual production and curtailment reached a new peak of 114% of total demand, up from 106% in October last year, with Victoria setting exceptionally high new record of 156%. The surplus lasted from 9:15 am to 3:10 pm.

What this month’s developments mean for market participants

Australian energy market

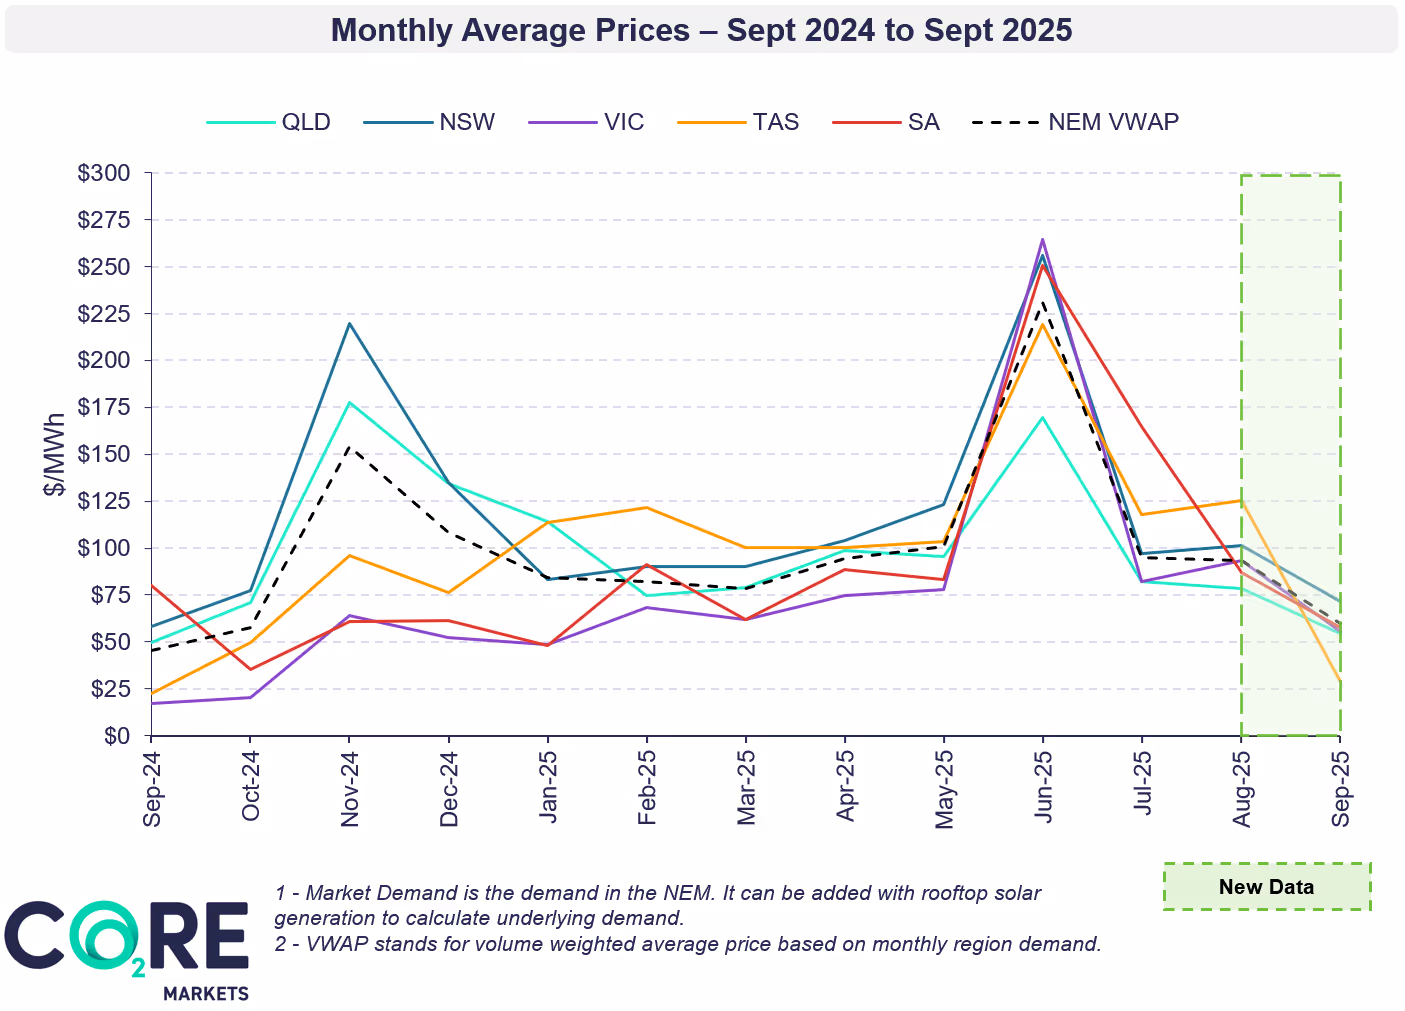
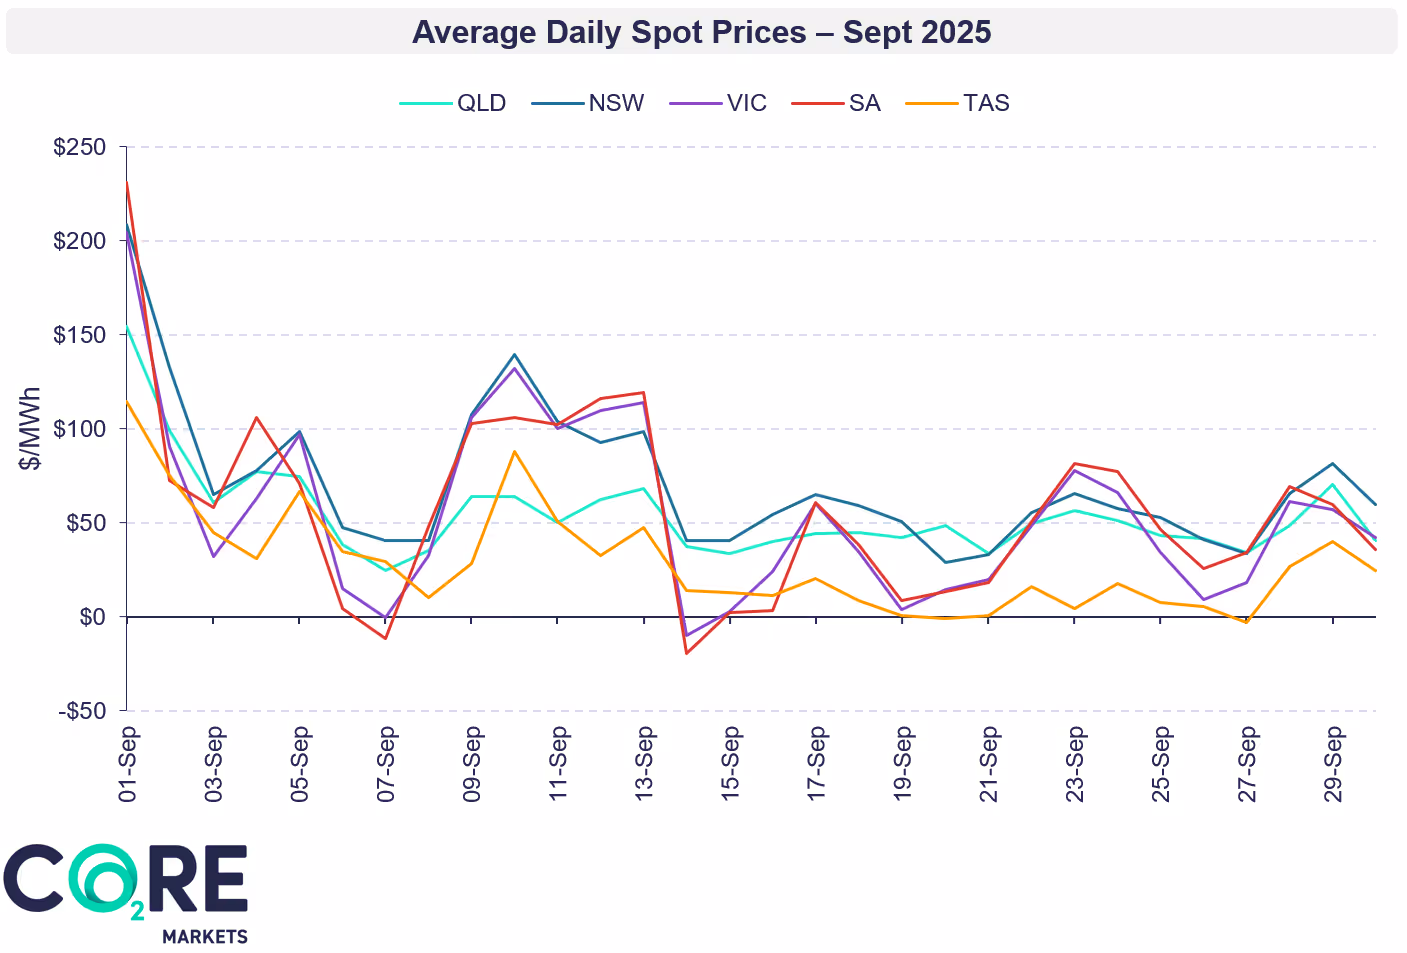
This month, the energy market experienced subdued pricing, with an increased frequency of negative price intervals. Seasonal spring trends resulted in higher renewable energy penetration coupled with lower demand across the NEM.

These shifting conditions emphasise potential opportunities and risks for spot-market exposed entities. Asset owners are likely to rely on alternate revenue streams such as PPAs, financial swaps, firm blocks, virtual and physical tolls amongst other offtake mechanisms. These contract mechanisms and in-depth market insights are outlined in CORE Markets’ offtake market report.

Similarly, potential buyers should look to establish appropriate hedging and contracting strategies, to minimise some of the seasonal risk. Compared to the significant volatility observed in winter, spring can present opportunities for buyers, highlighting the need to lock in sound hedging strategies with appropriate timing.

The CORE Markets team partners with renewable energy developers and corporate buyers to manage market risks.  Get in touch to explore how we can support your energy market approach.

Australian environmental markets

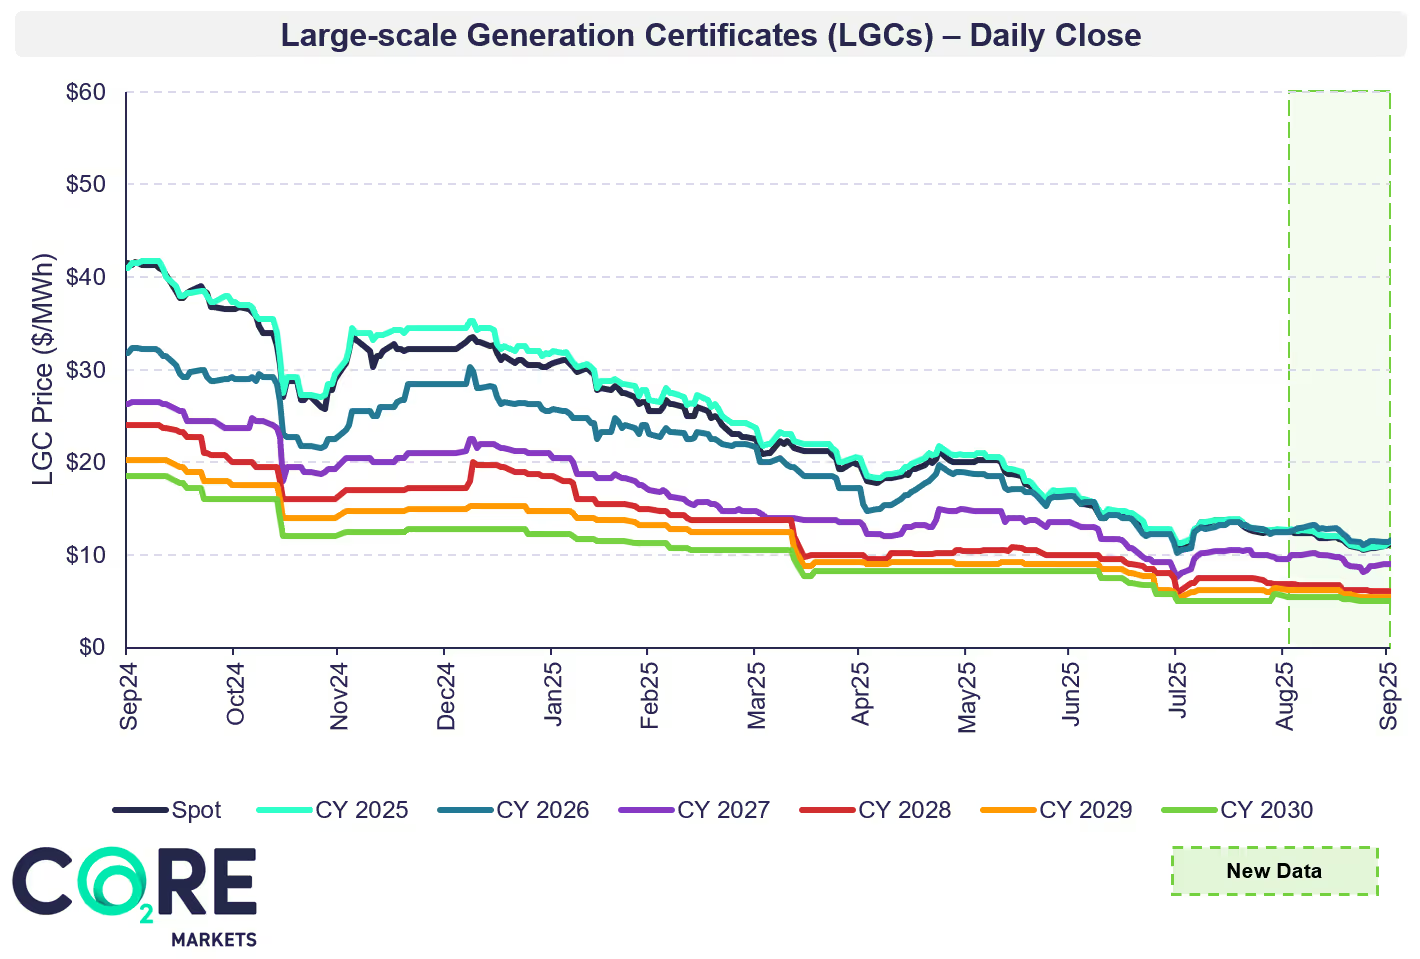
The LGC market continued a downward trend in spot and forward pricing outcomes through September, while ESC, VEEC and PRC markets showed price volatility based upon policy and compliance dynamics. Staying ahead of these regulatory changes can help guide procurement strategies  manage costs effectively.

The CORE Markets team supports demand and supply side market participants in navigating these markets – across strategy, procurement and trading execution. Get in touch to learn how we can support your goals.

Do you need help navigating energy and environmental markets?

The events outlined in this month's update highlight the evolving nature of energy and environemental markets and the complexity of the net zero transition.

To discuss your unique requirements, get in touch with our team today to see how we can help.

Tags

Share this article

Receive more articles like this

You Might Also Like
Australian Energy & Environmental Market Update - September 2025
Market Update

Australian Energy & Environmental Market Update - September 2025

The latest edition of our monthly Australian Energy & Environmental Market Update is now available. Keep reading for energy and environmental price movements, policy updates and other news.

Global Environmental Markets Report - September 2025
Market Update

Global Environmental Markets Report - September 2025

This report is published monthly and provides a high-level overview of the key developments in select compliance and voluntary carbon, and Sustainable Aviation Fuel markets.

Contracts, liquidity and risk: The NEM Review through a commercial lens
Article

Contracts, liquidity and risk: The NEM Review through a commercial lens

From visibility reforms to the ESEM, the Nelson Review puts contracts at the centre of the NEM’s future. We explore the implications for liquidity, risk allocation, and the bankability of new investment.