Resources
Insights
Australian Energy & Environmental Market Update - July 2025

Australian Energy & Environmental Market Update - July 2025

The latest edition of our monthly Australian Energy & Environmental Market Update is now available. Keep reading for energy and environmental price movements, policy updates and other news.

Updated
August 12, 2025
Published
August 12, 2025
Australian Energy & Environmental Market Update - July 2025

Australian Energy & Environmental Market Update July 2025

This month’s update covers July’s spot market trends, with higher renewable energy penetration across all NEM regions, contributing to a decline in prices from the elevated levels in June. We also cover wind asset performance, highlighting the top performing assets that took advantage of the strong wind generation across the NEM.

In the environmental markets, we highlight the surge in STC creations this month, driven by the Cheaper Home Batteries Program. This program is featured in our news highlights, along with details of the updated Capacity investment scheme (CIS), the release of the 2025 enhanced locational information and the final 24-25 GenCost report.

Australian electricity spot market

Monthly electricity spot market trends

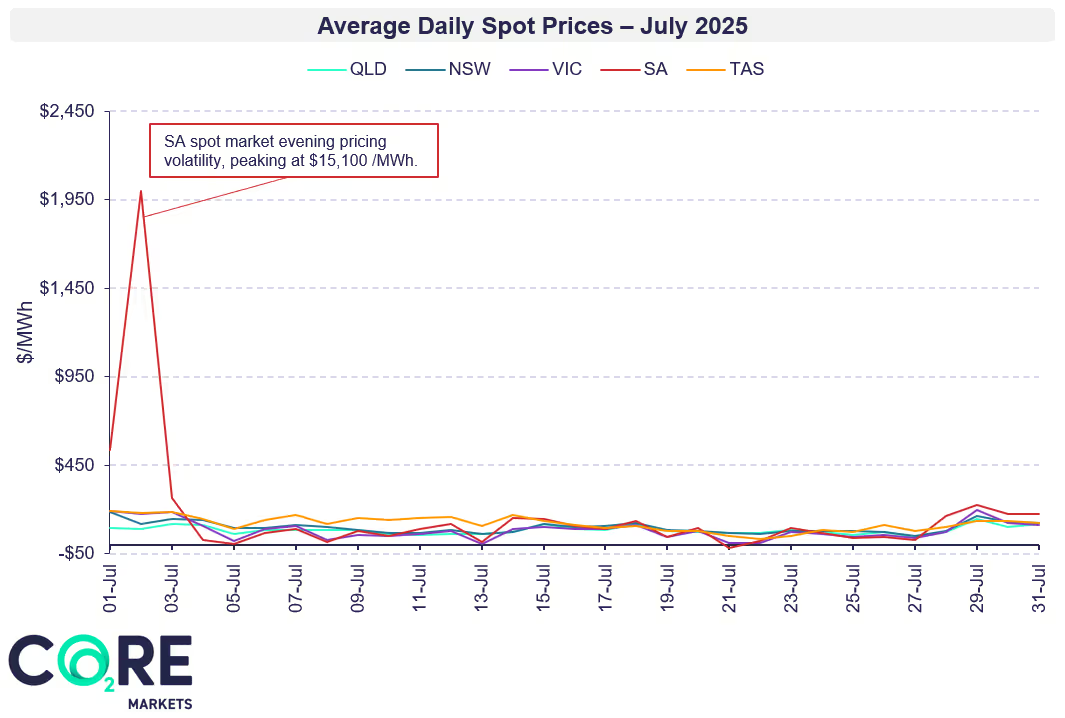
This month the electricity spot market experienced a sharp decrease in monthly average prices across all NEM regions, following last month’s record high, when prices exceeded a $200/MWh monthly average. NSW and VIC saw the steepest decline, decreasing over $150/MWh and $180/MWh, respectively.

  • Overall, the NEM-wide volume weighted average price (VWAP) declined by 59% to $95.15 /MWh compared to last month, returning to levels last seen in April.
  • NEM-wide demand totalled ~20 TWh for the month, the highest level this year, up 651 GWh (3.7%) from last month. However higher renewable energy generation from wind (810 GWh increase) and utility solar (108 GWh) underpinned the lesser reliance on gas-fired generation, a reduction of 450 GWh from last month, helping to stabilise spot prices.
  • Compared to July 2024, spot prices across all NEM regions fell significantly, with the NEM-wide VWAP 33% lower year-on-year. Notably, July 2024 experienced numerous unplanned coal outages and Heywood interconnector constraints that put upward pressure on pricing.  
  • SA was a notable outlier, recording the highest regional price this month at $164.95 /MWh. The region also remained the most volatile, with the highest frequency of both high-price and negative-price intervals, though to a lesser extent than last month.

Daily electricyt spot market trends

Relative to last month, the number of high price intervals (above $300/MWh+) softened across the NEM while negative price intervals increased in frequency recording an increase of 2,343 negative intervals across the NEM

  • On the 1st of July, AEMO announced the new market cap price of $20,300 and cumulative price threshold (CPT) increased to $1,823,600.
  • Just a day later, SA experienced a prolonged period of volatility, pushing the daily average price to $1,999 /MWh. This was driven by a low in wind generation, with the daily generation just 1.26 GWh, 95% lower than the daily average for the month. Additionally, an outage along one of the transmission lines from southeast to Tailem Bend limited interconnector supply from VIC into SA during this period.
  • Evening volatility proceeded late in the night reaching a peak of $15,100 at 10:30 PM. SA spot market reached a CPT of $1,576,239 which would have triggered administered price if not for the newly increased CPT.

Electricty Futures market

  • This month prices softened across most forward markets following last month’s extreme upward movement. Noting that CY28 futures in QLD edged slightly up by $0.56 /MWh towards the end of the month. The overall softening was primarily driven by lower spot market outcomes, with CY26 futures dropping by an average of ~$4.00/MWh in QLD, NSW, and VIC.
  • Of note, SA market was the strong outlier, with upward pressure in the futures market reflecting recent spot outcomes, CY26 increased by $1.06, CY27 by $3.52, and CY28 by $1.78/MWh.
  • Traded volumes declined compared to last month but remained significantly higher than in July last year. In SA, most trading occurred on the 16th and 17th, with the market remaining largely illiquid for the rest of the month.

Log in to the CORE Markets platform for more data, insights and commentary. Don’t have an account? Learn more

Renewables markets

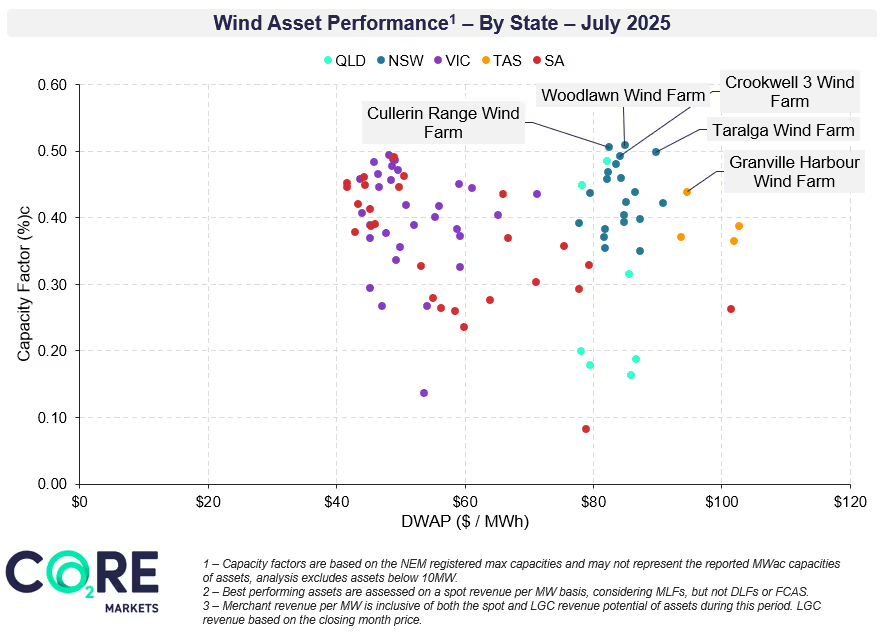
NEM-wide Variable Renewable Energy (VRE) penetration increased by 4.26 percentage points from last month, rebounding from the June decrease to land above May levels. This was primarily driven by a NEM wide increase to wind generation, with individual state-based wind penetration increasing from 1 to 5.3 percentile points month-on-month depending on the region.

Monthly rotating focus: Wind asset performance

Each month we feature a different asset type - rotating between coverage of solar, wind and BESS projects. This month's focus is wind asset performance.

  • Aggregate wind generation increased by 25% across the NEM in July relative to June. This was primarily driven by increased output in NSW (303 GWh) and VIC (317 GWh).
  • This increased wind output was reflected in asset capacity factors (CF) wherein the average NSW CF increased by almost 15 percentile points up to 41.5% with the best performing assets reaching capacity factors of 50%. Similarly, the average VIC CF increased by 8.3 percentile points up to 38.7%.
  • Dispatch weighted average prices (DWAPs) however decreased in all states with the NEM wide average landing at $65.37 down 39% month-on-month or 37% year-on-year. Importantly as mentioned above July 2024 and June 2025 both experienced highly volatile pricing exacerbating these relative decreases.
  • Overall, NEM wide average total merchant revenue per MW for wind declined by 26% into July at ~$21k /MW/ month. This was driven by reductions across QLD, SA and VIC while NSW and TAS revenues remained stable month-on-month owing to the higher generation.
Looking for more in-depth renewables asset analysis?
Learn more about our Renewable Energy Offtake Market Report, an important and recurring pulse check for renewable energy buyers and seller.

Environmental markets

Large-scale Generation Certificates (LGCs)

  • The trend of downward pricing progression in the LGC market continued through to the mid to late part of July.
  • A rebound was seen towards the close of July trading across the spot and forward curve as pricing appeared to hit a support level. This correction to the earlier bear-run was bolstered by compliance purchases stretching out to Cal27.
  • It coincided with the announced expansion of the Capacity Investment Scheme (CIS) which signalled the Commonwealth’s willingness to explore project financing support through underwriting, in response to falling LGC prices.
Log in to the CORE Markets platform for more data, insights and commentary. Don’t have an account? Learn more

Small-scale Technology Certificates (STCs)

  • STC creations surged in July, with weekly increase exceeding1 million certificates, which can be attributed to the new battery methodology that has been taken up enthusiastically by APs.
  • The market has been moribund, with battery STCs being directed straight to the Clearing House deficit and immediately acquired by the CER, which is running the new Cheaper Home Batteries Program by buying STCs and subtracting their value from the cost of those batteries.

Victorian Energy Efficiency Certificates (VEECs)

  • VEEC creations have remained strong since the registry update of late May to June, with volumes returning to previously seen levels. The breakdown of methodologies remains unclear, however, as that public data is no longer published by the VEU. Supply is anticipated to soften with the gazetting of one of the market's most prolific methodologies, Commercial and Industrial Heat Pump Water Heaters, responsible for some 20% of total issuance in the year to May 15th, ahead of the registry shutdown. The spot opened at $94.00/certificate and closed July at $96.00/certificate.

Energy Saving Certificates (ESCs)

  • The ESCs markets were somewhat subdued throughout July. Creation figures were minimal across the month, except for a tranche of creation early in the month with the week ending 4th of July seeing ~120k certificates created. The spot opened at $20.75/certificate and closed July at $22.80/certificate.

Peak Reduction Certificates (PRCs)

  • PRCs are continuing to see sizable volumes of battery creation coming through from individual accredited person (APs). This supply will however dry up by a material amount as battery PRCs are gazzetted. The spot traded sideways this month at $3.05/certificate.

Looking for ACCU coverage? Read our ACCU Market Monthly Report here.

Market news

Update to the Capacity Investment Scheme

  • The Capacity Investment Scheme (CIS) is an Australian Government initiative aimed to accelerate investment in renewables, specifically wind and solar, and clean dispatchable capacity like battery storage systems by underwriting project revenues through competitive tenders.
  • On the 29th of July, the Commonwealth expanded the CIS capacity by 25% from 32 GW to 40 GW with renewable generation capacity rising from 23 GW to 26 GW, and clean dispatchable capacity increasing from 9 GW to 14 GW. The rise corresponds to the lagging renewable energy buildout relative to the rate required to meet the Australian Government’s 2030 renewable energy target of 82%, which underpins the agreed goal of a 43% reduction in emissions by 2030 as compared to 2005. In this context, projects set to be operational by 2030 will continue to score more favourably on the merit criteria. As demand grows and older coal-fired plants phase out, the initiative is focused on boosting electricity generation and preserving system reliability while placing downward pressure on electricity prices.
  • Despite the additional capacity, the government has indicated that they expect the expansion to be cost neutral given the decreasing costs of batteries and solar.
  • The assessment process has also been updated, shifting to a single stage tender with timelines shortening from nine to six months, requiring proponents to submit all bid components upfront, including the financial details, to prevent bid overlaps across rounds.
  • An initial eligibility and merit review by AEMO will exclude ineligible bids at early stages, and a merit assessment and due diligence will be done for eligible bids before being recommended to the Australian Government.

2025 Enhanced Locational Information (ELI) released

  • The 2025 Enhanced Locational Information (ELI) Report released on the 9th of July marks the second release of this new edition within AEMO’s suite of annual reports. The ELI, by analysing curtailment in both the current and future state of the electricity system, aims to increase the transparency and accessibility of locational investment signals.
  • While over half of all VRE assets in the NEM experienced technical curtailment of less than 1% across 2024, asset-specific curtailment was as high as 4.8% for wind and more than 25% for solar. This saw wind and solar average 1.1% and 4.5% network curtailment, respectively.
  • High curtailment was strongly concentrated in Western NSW and North West VIC. In these regions, modelling indicates that additional capacity (300 MW) would face curtailment above 65% between 2026-2028.
  • While the medium-term (2030-2035) outlook indicates a significant improvement in curtailment across all mainland NEM regions (limiting curtailment above 35%  to SA and a few select locations in NSW) this is highly dependent on the delivery of a significant pipeline of transmission projects, many of which have been facing cost overruns and delays.
  • This emphasises the importance of efficient locational investment, with AEMO indicating that one of the major barriers to reaching the 82% renewable energy target is the management of transmission buildout and resulting system constraints.
  • See the full report here, AEMO | Enhanced Locational Information (ELI), including detailed graphical representations and further analysis.

Cheaper Home Batteries Program launched

  • The Australian Government has launched its Cheaper Home Batteries Program as of July 1st backed by $2.3 billion under the Small-scale Renewability Energy Scheme (SRES), overseen by the Clean Energy Regulator (CER). The rebate aims to increase the proportion of households with behind-the-meter battery storage systems paired with their solar PV systems.
  • 9.3 STCs are awarded per kWh of usable battery capacity installed up to 50 kWh. At an estimated $40 per STC, this roughly equates to the targeted discount rate of 30% to be supported by the government program, which will be adjusted on an annual basis.  
  • Roughly 1000 new registrations for batteries were issued daily for the first few weeks.
  • Many battery retailers are suspected of taking advantage of heightened demand for batteries, leveraging the program to sell batteries of larger capacities than necessary for a household. When paired with inverters and/or solar PV systems that are ill equipped to properly support them, this can result in a mismatch between rated capacity and power output.
  • As a result, the average capacity of installed batteries has increased with new batteries averaging 18 kWh, a significant increase from 2024 and 2023's average capacity of 11.75 kWh and 11.3 kWh installed, respectively.
  • Analysts, including Ronald Brakes, argue that due to higher than predicted demand and installation capacities, the rebate is set to run out of money by 2028, two years prior to its planned ending at the end of 2030.

Final 24-25 GenCost released

  • In collaboration with AEMO, CSIRO has released the final version of the 2024-25 GenCost report (which in turn feeds into AEMO’s final 2025 Inputs and Assumptions Report) outlining the relative costs of building and running generators.
  • The report sates that renewables backed by storage and transmission continue to be the lowest cost new-build electricity generation technologies, while noting that Australia’s energy transition will require continued support from gas and pumped hydro.
  • Some key trends include:
    • Considerable decreases in capital costs for solar PV and large-scale solar PV systems, with 20% and 8% year on year reductions in costs, respectively.
    • Wind and gas have been less quick to adjust to global inflation pressures, both increasing in capital costs by 6% and 11%, respectively.
    • Solar PV and wind with firming are forecast to decrease in LCOE from 2024 to 2030, going from $120-$160 /MWh (60% VRE share) to $83-$124 /MWh (80% VRE share).
    • Gas with Carbon Capture and Storage (CCS) is also set to decrease, however, will remain at a significant premium, going from $204 - $307 /MWh to $158 - $266 /MWh. Further large first-build premiums must be considered as it is not a technology yet deployed in Australia.
  • See the full reports here GenCost: cost of building Australia’s future electricity needs - CSIRO and here AEMO | 2025 Inputs Assumptions and Scenarios Consultation

What this month’s developments mean for market participants

Australian energy market

This month the energy market eased from the elevated levels experienced in June, with both spot market and futures seeing relatively subdued pricing for July, although SA still experienced periods of extreme volatility early in the month.  Wind assets saw increased generation, lifting capacity factors for most assets.

For asset owners and market participants, understanding key seasonal trends in the market highlights the importance of strong market knowledge and effective hedging strategies to manage the impact of seasonal variations and maximise revenue opportunities.

The CORE Markets team partners with renewable energy developers and corporate buyers to manage market risks.  Get in touch to explore how we can support your energy market approach.

Australian environmental markets

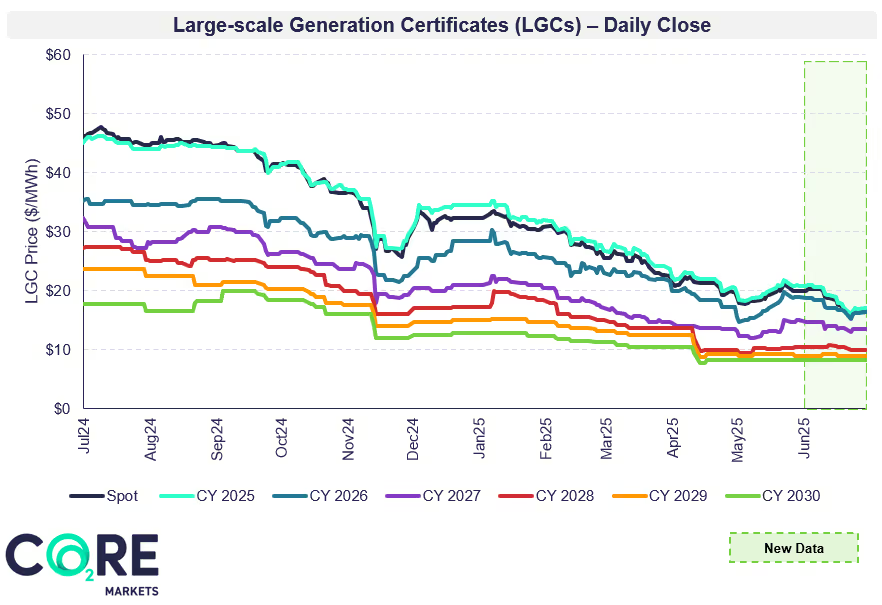
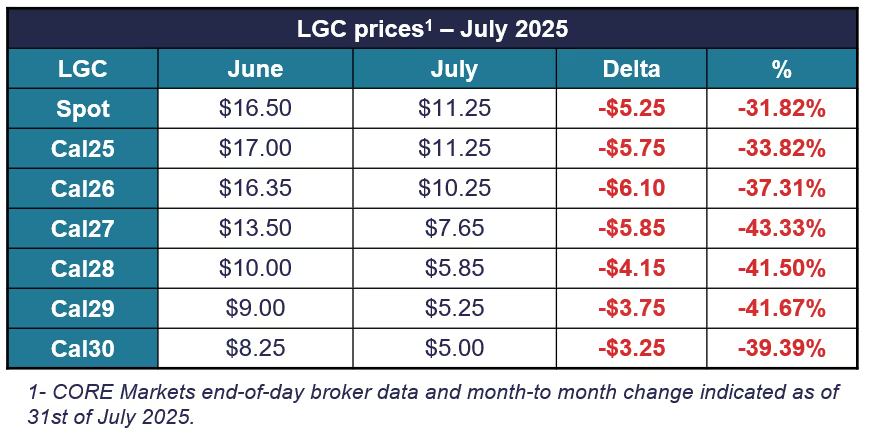
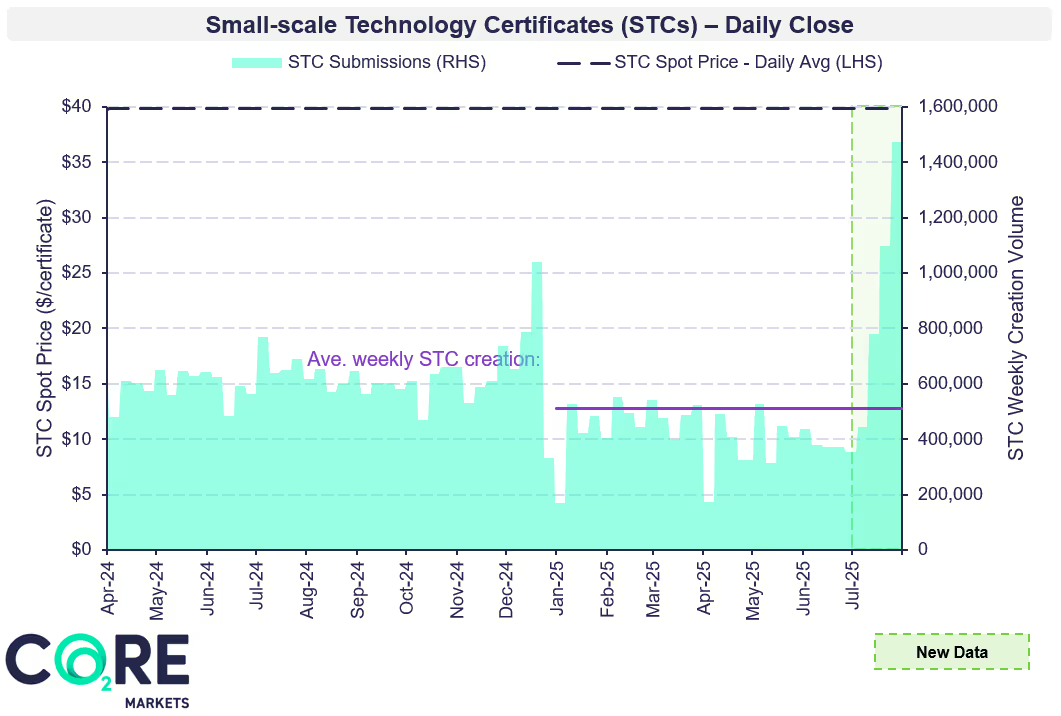
LGC market activity declined again this month, with both spot and forward prices falling. STCs showed a surge in creation activity, with a weekly increase exceeding1 million certificates, driven by the Cheaper Home Battery Program. Staying ahead of new programs and regulator changes is key to guiding procurement strategies to take advantage of opportunities and keep costs low.

The CORE Markets team supports demand and supply side market participants in navigating these markets – across strategy, procurement and trading execution. Get in touch to learn how we can support your goals.

Do you need help navigating energy and environmental markets?

The events outlined in this month's update highlight the evolving nature of energy and environemental markets and the complexity of the net zero transition.

To discuss your unique requirements, get in touch with our team today to see how we can help.

Tags

Share this article

Receive more articles like this

You Might Also Like
Australian Energy & Environmental Market Update - July 2025
Market Update

Australian Energy & Environmental Market Update - July 2025

The latest edition of our monthly Australian Energy & Environmental Market Update is now available. Keep reading for energy and environmental price movements, policy updates and other news.

Global Environmental Markets Report - July 2025
Market Update

Global Environmental Markets Report - July 2025

This report is published monthly and provides a high-level overview of the key developments in select compliance and voluntary carbon, biodiversity and Sustainable Aviation Fuel markets.

ACCU Market Monthly Report - July 2025
Market Update

ACCU Market Monthly Report - July 2025

This report provides an overview of the month’s Australian Carbon Credit Unit (ACCU) market activity along with key developments and milestones.